DATABASE SUPPORT PAGE
FX Database Searches

- Users can carry out a variety of different variant searches on this site. Users have the option to search for variants of specific types (e.g. deletion, insertion or point) and effects (e.g. frameshift, inframe, missense, nonsense or silent). Users can also search for variants at defined residues or within specific protein domains. Additionally, users can search for variants based on the references in which they appear.
- The search forms are simple and if no fields are filled in the search will return all variants within the database.
- The results of each search are shown as an HTML interface, where patient data can either be displayed or omitted at the touch of a button. The full list of variants can be downloaded as an Excel file or in tabular format by clicking the respective buttons at the top of the Full List Results page.
- The quick-search features on the home page can be used to retrieve data on variants of a specific type or with defined cDNA or amino acid numbers.
Variant Data

- This site uses HGVS guidelines to identify all variants by cDNA number. cDNA sequences are numbered from +1 starting with the A of the FX ATG initiation codon (c. represents cDNA).
- In some cases, Legacy numbering is used in the original literature to identify variants by cDNA number. The most common Legacy numbering system used follows that of Leytus et al 1986 . If Legacy numbering has been used, the Legacy cDNA numbering is cited in the comments section below the variant information on the Results pages.
- Reference sequences are taken from the following files: NP_000495.1 (protein) and NM_000504.4 (mRNA).
- Both HGVS and Legacy numbering are used on this site to identify each variant by amino acid number. HGVS guidelines state that codons should be numbered starting from the ATG initiation codon (+1) and should include the pre-pro leader peptide. Whereas, Legacy numbering assigns codon +1 to the first codon of the mature FX protein (ie. excluding the pre-pro leader peptide).
- The phenotype field indicates the phenotypic classification of the variants. Phenotype is determined using the reported levels of FX activity (FX:C) and FX antigen (FX:Ag) in the patient's plasma.
- A low FX:Ag plasma level indicates a Type I phenotype (CRM-), where the mutant protein is present in low amounts. Such variants likely have structural effects on the FX protein, affecting stability and secretion.
- A normal or high FX:Ag plasma level indicates a Type II phenotype (CRM+), where the mutant protein is present in normal amounts but is dysfunctional.
- Some variants have an undefined phenotype and are described as 'U'.
- NOTE: A number of the patients are compound heterozygous for different variants, which can affect phenotypic analysis.
Allele Count (AC), Allele Number (AN) and Allele Frequency (AF)

This site uses the gnomAD database v2.1.1 to determine Allele count (AC), Allele Number (AN) and Allele Frequency (AF). The gnomAD v2 dataset spans 125,748 exome sequences and 15,708 whole-genome sequences.
- Allele Count = The number of times a variant of interest appears in a population.
- Allele Number = The total number of alleles sequenced at a given location within a population.
- Allele Frequency = Allele Count/ Allele Number. ** Note: All AF values are rounded to 6 d.p.
Allele Frequency is used as an indication of the relative frequency of a given variant at a specific genetic locus. The larger the AF value, the more common the variant.
Note: Many FX variants listed on our site are rare and do not appear in the gnomAD v2 population, thus they do not have AC, AN or AF values.
Patient Data

- Patient data can be displayed for each variant using the "SHOW" button under the variant information.
- The patient data in this database is taken wherever possible from the literature reporting the variants. Such patient data includes the FX:C and FX:Ag assay results, aswell as standard patient information such as age, gender and race. Inheritance and disease severity are also recorded in the patient table. Any additional relevant information is reported in the comments column of the table.
Missense Variants - Structural Interpretation

- To better understand the effects of missense variants, links are provided on the variant results pages to direct users to additional analysis.
-
The results of four distinct substitution analyses are provided for each identified missense variant. Such analyses predict the damaging effects of the substitution variants.
- Grantham:
Grantham scores range from 0 to 215. The higher the score, the more damaging the amino acid substitution is predicted to be. - PolyPhen-2:
PolyPhen scores of 0.000 - 0.450 predict benign variants, scores of 0.450 - 0.950 predict possibly damaging variants and scores of 0.950 - 1.000 predict probably damaging variants. The HumDiv database was used for the PolyPhen predictions on this site. - SIFT (Sorting Intolerant From Tolerant):
SIFT scores of < 0.05 predict a potentially damaging variant whereas, SIFT scores > 0.05 predict a likely tolerated variant. - PROVEAN (Protein Variation Effect Analyzer):
PROVEAN scores below the defined threshold (here -2.500) predict variants to be deleterious, whereas variants with PROVEAN scores above the threshold are likely neutral.
- Grantham:
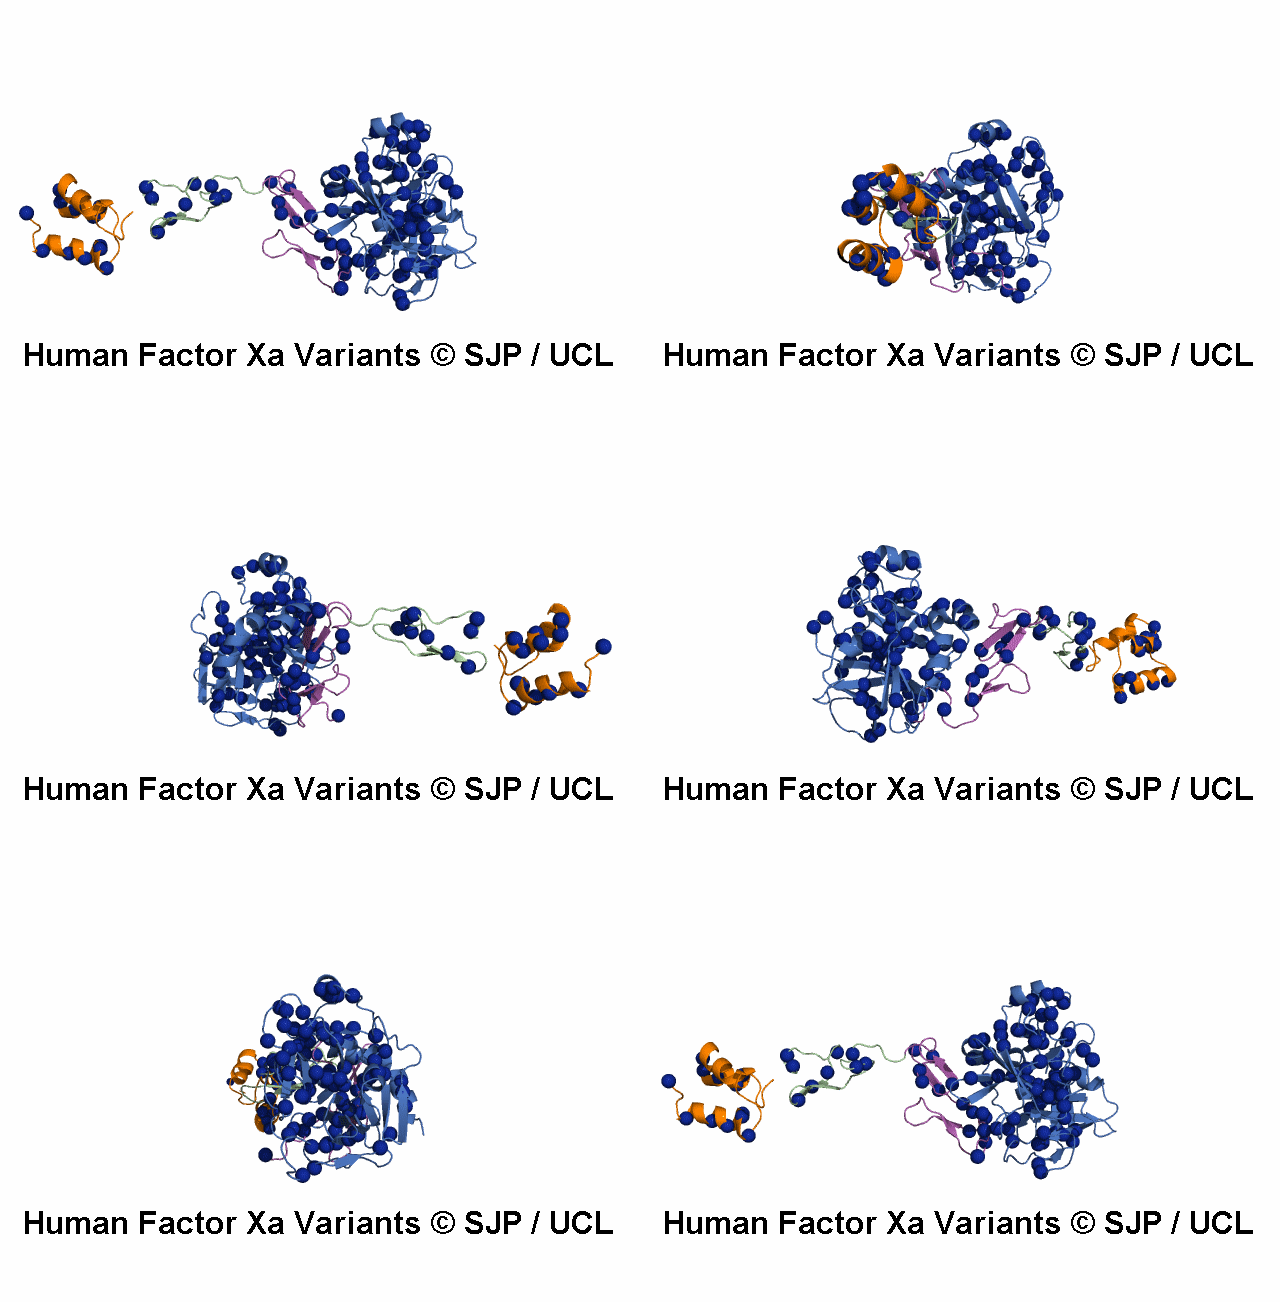
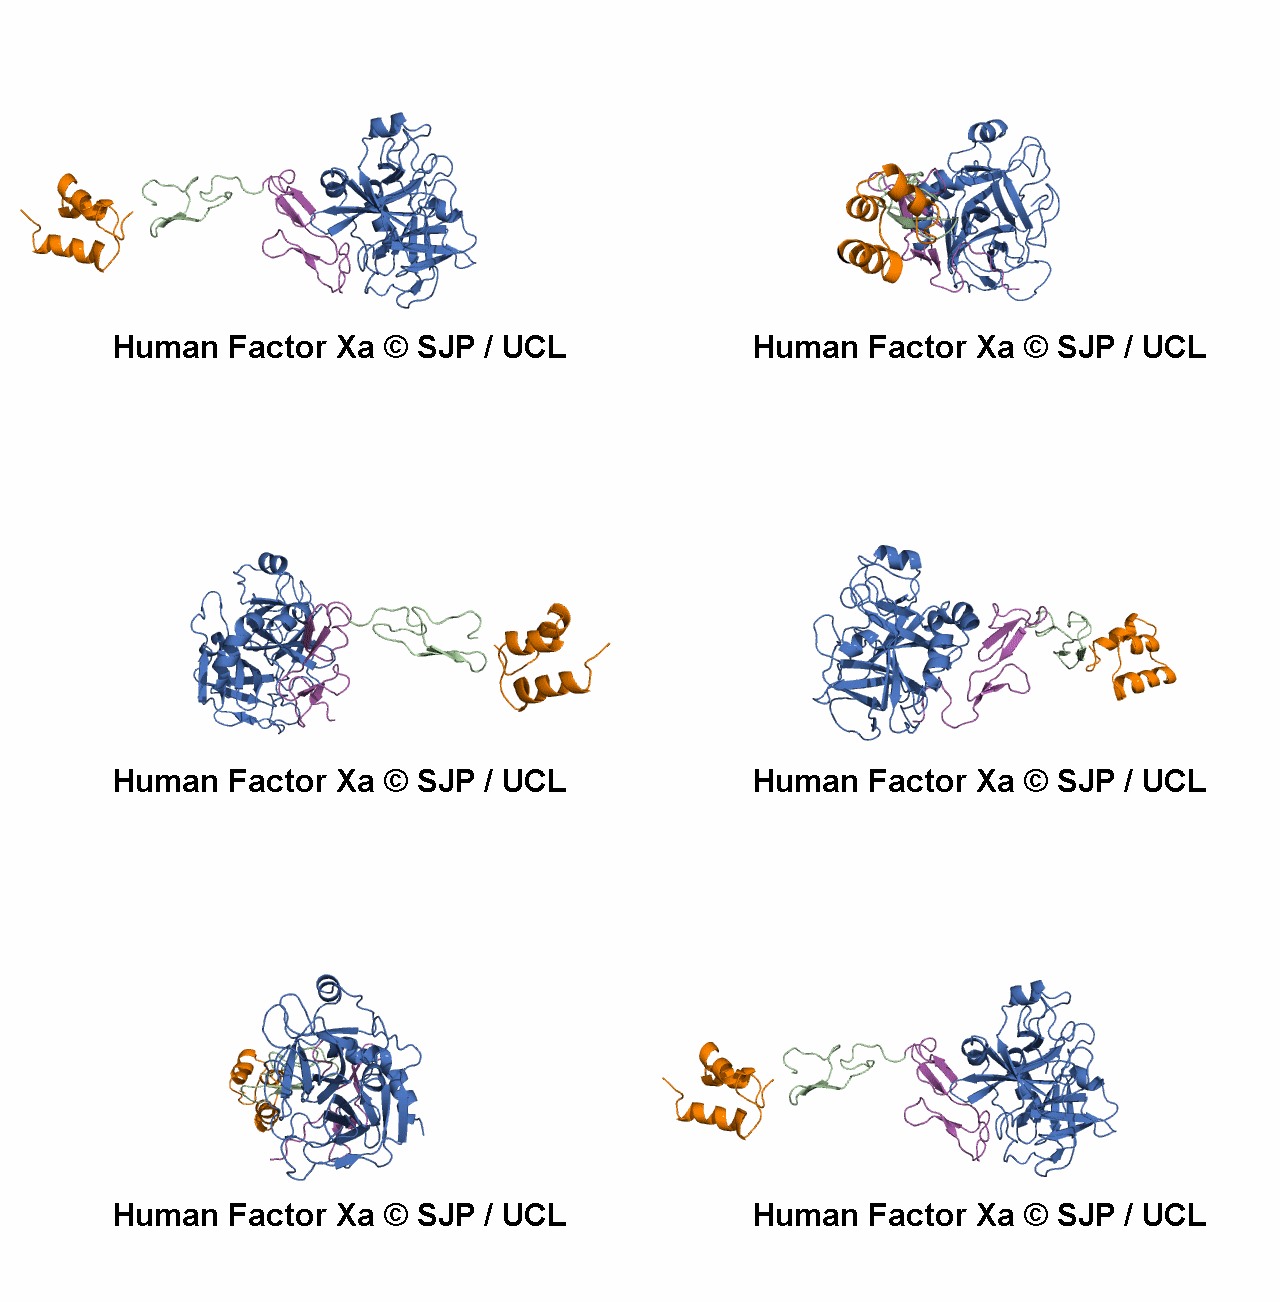
- A structural model of the FX protein is illustrated below the substitution analysis, enabling users to visualise the location of the mutant residue under study and interpret its effects. The FX structure used is a stitched model of the 1P0S and 1XKA PDB structures.
-
Surface accessibility values are determined using the DSSP online program (using the stitched 1P0S/1XKA model). DSSP output gives surface accessibility in terms of "number of water molecules in contact with the defined residue *10 in Å2". Values are converted into % accessibility using each residue's theoretical ASA value, given in Tien et al 2013. The resultant %s are transformed into integers 0-10, where % accessibility:
- 0-9% = 0
- 10-19% = 1
- 20-29% = 2
- 30-39% = 3
- 40-49% = 4
- 50-59% = 5
- 60-69% = 6
- 70-79% = 7
- 80-89% = 8
- 90-99% = 9
- DSSP assignments define the structural location of the residue and are again determined using the DSSP program (using the stitched 1P0S/1XKA model).
- H = α-helix
- B = Residue in isolated β-bridge
- E = Extended strand, participates in β ladder
- G = 3-helix (310 helix)
- I = 5 helix (π-helix)
- T = Hydrogen bonded turn
- S = Bend
- C = Coil
References

- Using the Advanced Search tool, users can search for variants identified by specific primary authors.
- On the results pages, in addition to listing the primary reference, other papers discussing the same variant are also cited.
- Each patient record has a reference field citing the reference that originally discussed the patient and variant.
- References are cited in full under the Reference (Resources) tab and the pubmed entry for each reference can be displayed be clicking the PMID link.
© Copyright 2003,
Structural Immunology Group,
University College London, Gower Street, London WC1E 6BT
**No part of this site may be copied or used in any way without permission.**
**No part of this site may be copied or used in any way without permission.**


